π₯¦Delta Exposure(DEX)
Last updated
Last updated
Option dealer delta exposure converts option trading size to an equivalent stock volume (bought or sold).
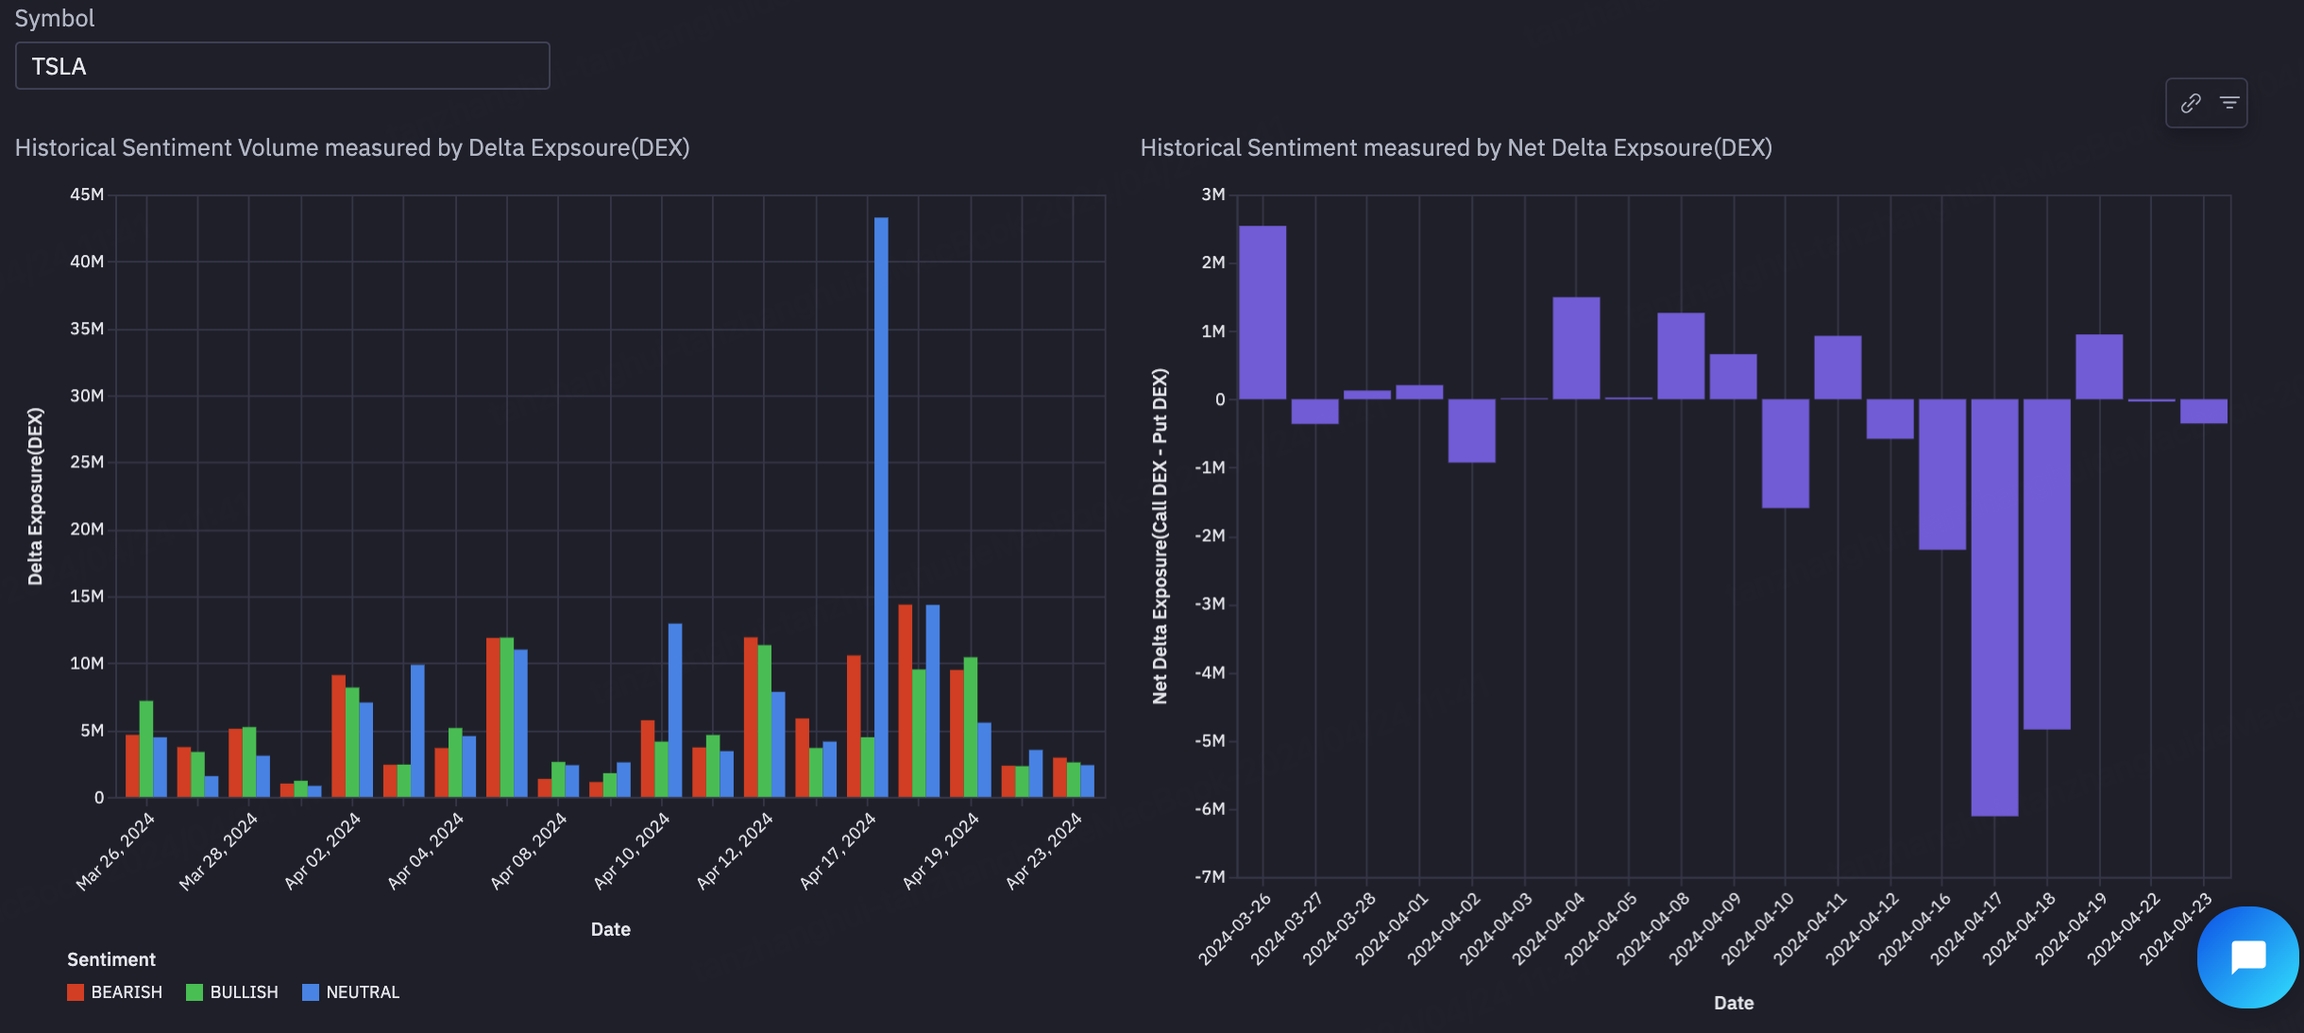
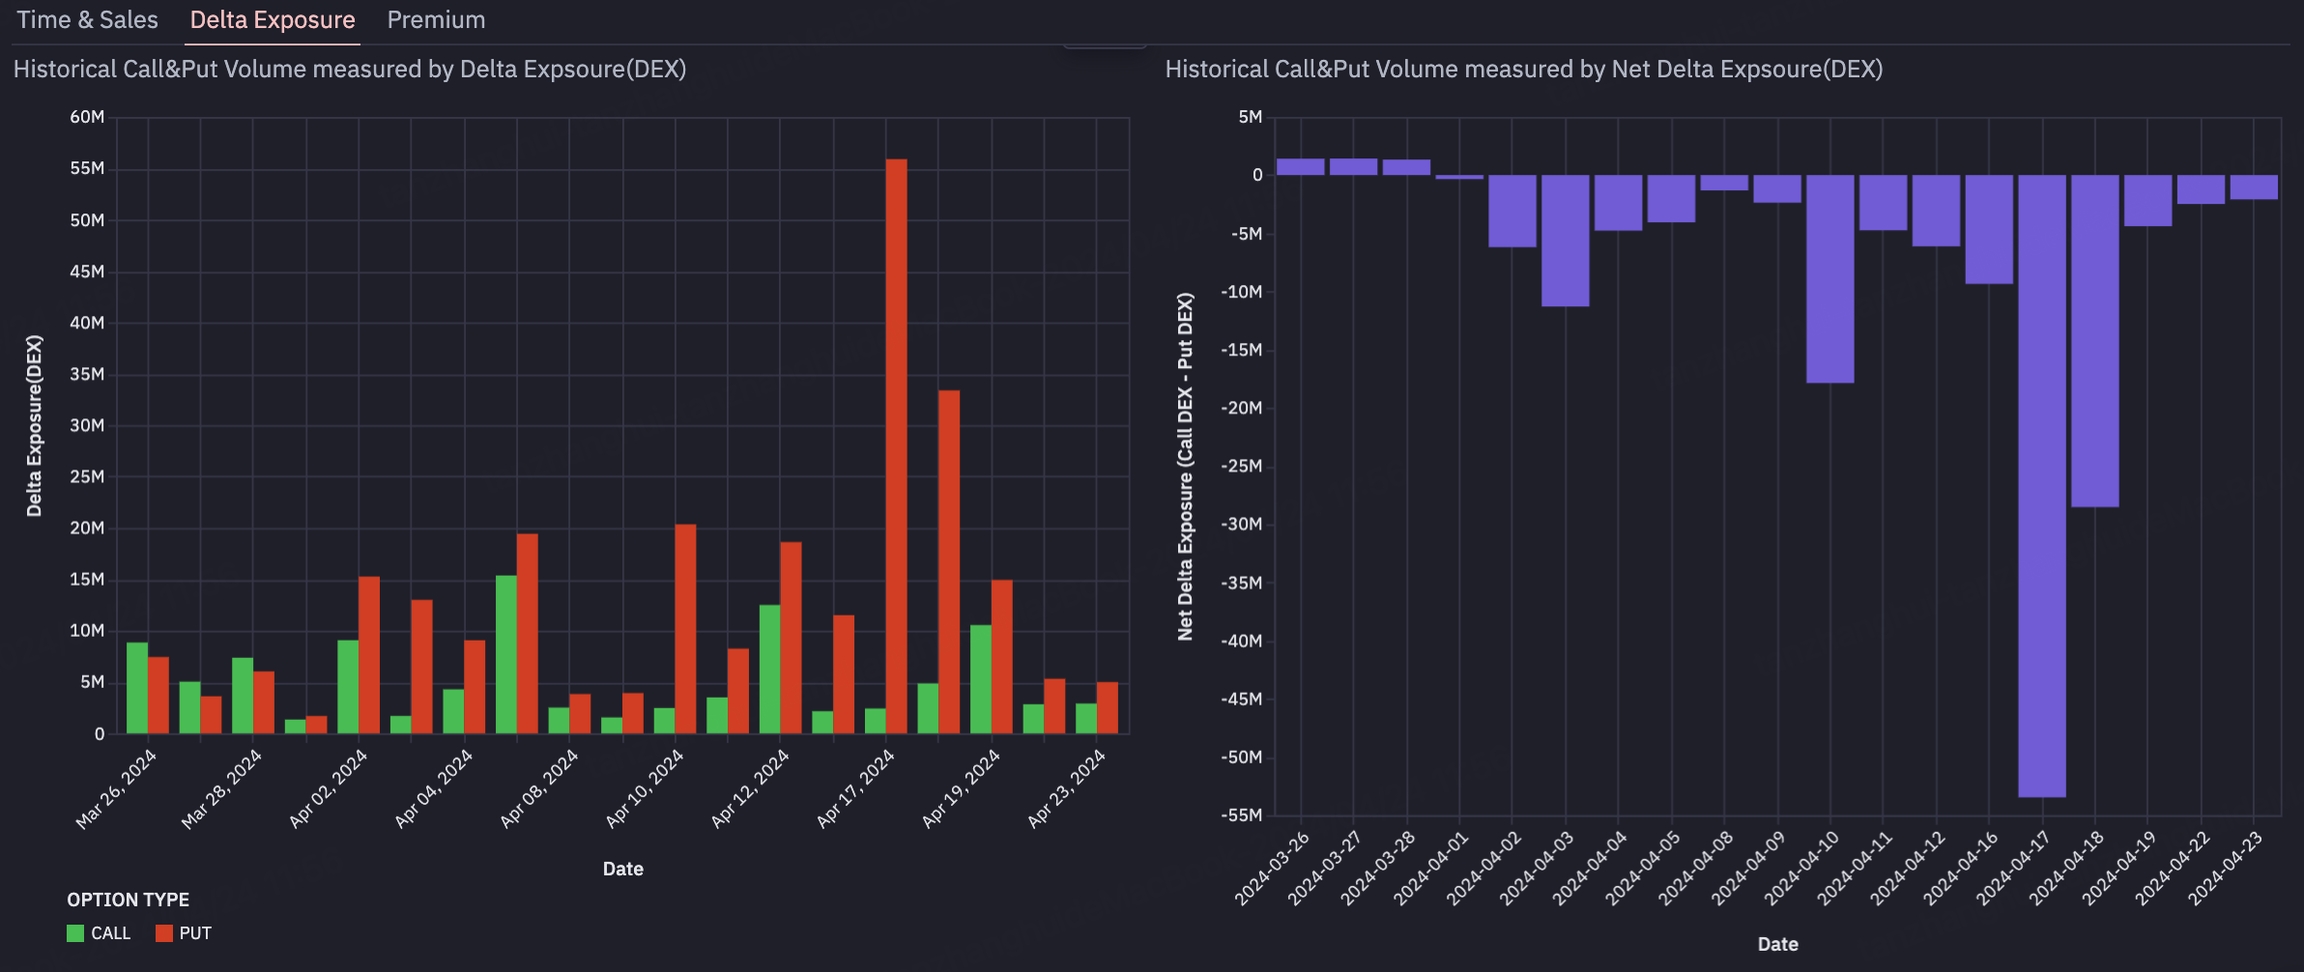
On TradingFlow Full Option Flow page, you can view DEX data based on stock codes to obtain sentiment, call, and put data quantified by DEX.
You can also use the Contract Explorer to view DEX dimension data for specific option contracts.
Suppose a customer purchases 10 call option contracts for AAPL stock, each with a delta of 0.60. This translates to a positive +600 delta(10 * 100 * 0.60 = 600), which is equivalent to owning 600 shares of AAPL stock. If the customer sells 5 call option contracts for AAPL stock, each with a delta of 0.20, this trade has a negative -100 delta(5 * 100 * -0.20 = -100). As a result, the net delta for both trades is a positive +500 deltas (600 bought - 100 sold = +500), or the equivalent of owning 500 shares of AAPL stock.
The following trade types have positive deltas :
Buying a Call
Selling a Put
Buying a Call Spread
Selling a Credit Put Spread
The following trade types have negative deltas:
Selling a Call
Buying a Put
Selling a Call Spread
Buying a Put Spread
Option delta exposure on-balance, can provide insight into the level of bullish or bearish pressure present in the option order flow. To determine the net imbalance, we subtract the total negative option delta exposure from the total positive option delta exposure traded during the day. If the net imbalance is positive, it indicates greater bullish pressure. Conversely, if the net imbalance is negative, it suggests a higher level of bearish pressure.
Option delta exposure is a better indicator than premium for bullish and bearish pressure because it directly measures the sensitivity of an option's price to changes in the underlying asset's price.
Consider this scenario: Two options are purchased with the same amount of money. If the underlying stock price increases by $1, the option with a higher delta will experience a greater increase in value compared to the option with a lower delta, assuming all other factors remain constant.
Delta measures the rate of change in the option price relative to changes in the underlying asset price. A higher delta indicates that the option's price will move more closely in line with changes in the stock price, reflecting a stronger bullish or bearish sentiment depending on whether the option is a call or put.
On the other hand, premium alone does not provide this direct sensitivity to changes in the stock price. Premium is influenced by various factors such as time decay, implied volatility, and interest rates, in addition to the intrinsic value based on the current stock price relative to the option's strike price.
This is because the Option contracts have varying strike prices and expirations, which can affect the notional value of a trade. However, the notional value alone may not be a reliable indicator of bullish or bearish pressure. To illustrate, consider two scenarios: buying 10 deep in-the-money option contracts for $100 and 10 deep in-the-money option contracts for $50. Despite paying twice as much for the $100 contracts, both options are expected to change by $1 for every dollar move in the stock, and exercising either option would yield the same amount of shares. Thus, in this case, the notional amount paid did not impact the outcome.
In contrast, suppose you buy one deep in-the-money call for $100 and an at-the-money call for $1. While the former costs $10,000 in notional value, the latter allows you to purchase 100 contracts for the same price, but with much more stock under control ($1 x 100 x 100 = $10,000). As a result, the second scenario provides a more significant stock volume for the same notional amount traded. Therefore, it is better to use the option delta exposure to gauge bullish and bearish pressure on the stock.
Take the example of SPY on 03/30/2023 as an example, the size of the contract traded is 422, and the delta is 0.41, so the delta exposure = 422 * 100 * 0.41 = 17.3k, which is equivalent to buying the stock of 17.3K, if this is an opening position, the option dealer has to buy 17.3 shares of SPY to hedge the risk.
This figure represents the overall net delta exposure in trading activity for the day, the green dot represents positive net delta exposure, and the red dot represents negative net delta exposure. In this case, there is a bullish volume imbalance of +1.5M delta exposure for the day (which is equal to a buy imbalance of +1,588,500 shares of stock).
For the concept of Bullish and Bearish, please refer to
This metric indicates how much bullish delta exposure contributes to the total delta exposure for the day. The larger this value, the more bullish the overall daily sentiment is. In this example, the Bullish Percentage of 56.37% = 6.68M(Bullish Delta Exposure) / (5.17M(Bearish Delta Exposure) + 6.68M(Bullish Delta Exposure)), the Bullish DEX(delta exposure) represents the aggregated delta exposure from the trades with the bullish sentiment, the Bearish DEX(delta exposure) represents the aggregated delta exposure from the trades with a bearish sentiment.
This metric indicates how much bearish delta exposure in OTM(Out Of Money) contributes to the total bearish delta exposure in OTM for the day. The larger this value, the more aggressive the overall bearish sentiment is. In this example, the Bearish OTM Percentage of 50.00% = 2.68M(OTM Bearish Delta Exposure) / (5.17M(Total Bearish Delta Exposure) + 2.68M(OTM Bullish Delta Exposure)).
This metric indicates how much bullish delta exposure in OTM(Out Of Money) contributes to the total bullish delta exposure in OTM for the day. The larger this value, the more aggressive the overall bullish sentiment is. In this example, the Bullish OTM Percentage of 40.00% = 2.76M(OTM Bullish Delta Exposure) / (6.68M(Total Bullish Delta Exposure) + 2.76M(OTM Bullish Delta Exposure)).
To capitalize on this, dealer can establish a position in an option and continuously hedge the delta throughout the option's lifespan. As the price of the underlying stock changes over time, the delta of the option also changes. For instance, if a trader buys one contract for a call option at-the-money with a delta of 0.5, the dealer initially needs to sell 50 shares of the stock to offset the delta. However, as the option's delta may fluctuate during the day or over several days, the delta may need to buy or sell additional shares to neutralize the delta.
By holding the options, the delaer can reduce its exposure to risk while providing the option liquity to the market as the stock price moves up and down. The greater the volatility in the stock's price, the higher the potential profit for the delaer, which can exceed the initial cost of buying the options. Consider the following example: IBM 18-Nov-16 160.00 strike call options. At the time of the trade, this option was at-the-money, and its delta was 0.5. Despite the options' value decreasing over the next few days, the delaer manages to profit from the movement in the underlying stock.
Buying IBM 18-Nov-16 160 Strike Call Option | |||||||||
---|---|---|---|---|---|---|---|---|---|
Date | Call Option Price | Call Option Delta | Net Delta | Stock Price | Shares Bought to Hedge Delta | Shares Sold to Hedge Delta | Call Option PNL | Stock PNL | Combined PNL |
2-Sep-2016 | 4.92 | 0.500 | 50 | 159.57 | 50 | ||||
6-Sep-2016 | 5.15 | 0.522 | 2 | 160.27 | 2 | +23.00 | -35.00 | -12.00 | |
7-Sep-2016 | 5.90 | 0.562 | 4 | 161.51 | 4 | +98.00 | -99.48 | -1.48 | |
8-Sep-2016 | 4.55 | 0.482 | -8 | 159.01 | 8 | -37.00 | +40.52 | +3.52 | |
9-Sep-2016 | 3.45 | 0.386 | -9 | 155.70 | 9 | -147.00 | +199.40 | +52.40 | |
12-Sep-2016 | 4.23 | 0.458 | 7 | 158.31 | 7 | -69.00 | +97.61 | +28.61 | |
13-Sep-2016 | 3.45 | 0.390 | -7 | 155.94 | 7 | -147.00 | +206.93 | +59.63 |
Q: Why did the price not go down when dealer deltas were green?
A: Positive dealer deltas indicate bearish customer sentiment, while negative dealer deltas suggest bullish sentiment. Great question! It's not just the value of the delta that determines sentiment; it's the daily change in dealer deltas. We look for either an increasing or decreasing delta daily. While the initial sign of deltas becoming bullish was observed, we required further confirmation in subsequent days to ensure the deltas kept decreasing, signifying an increasingly bullish customer sentiment.