🥒Open Interest
Quick overview
Open interest: Open interest is the total number of active option contracts that are currently outstanding (not yet closed, exercised, or expired). It reflects the number of open positions in the market.
Open interest vs. volume: Volume shows the number of option contracts traded in a single day, while open interest tracks the total number of open contracts across all trading days. Volume resets daily; open interest is cumulative until positions are closed.
Open Interest in Simple Terms
Open interest (OI) is the total number of outstanding option contracts that have been opened but not yet closed, exercised, or assigned. Unlike stocks, which have a fixed number of shares, options allow for the creation of new contracts. Every time a buyer and seller initiate a new contract, OI increases. When one party opens and the other closes, OI remains unchanged. If both parties close positions, OI decreases.
Importance of Open Interest
OI reflects market participation and liquidity, not trade volume. High OI often indicates strong interest or conviction in a particular strike or expiration. For traders, it helps assess:
Market Sentiment: Open interest can help traders gauge market sentiment. A rising open interest often indicates that new money is entering the market, suggesting a continuation of the current trend. Conversely, declining open interest may signal that traders are closing their positions, which could indicate a potential reversal.
Liquidity: Higher open interest typically correlates with greater liquidity, making it easier for traders to enter and exit positions without significant price impact. This is particularly important for options trading, where liquidity can vary widely between different contracts.
Price Movement: Analyzing open interest alongside price movements can provide insights into potential price trends. For instance, if open interest increases while the price rises, it may suggest that the upward trend is supported by new buying interest.
Identifying Support and Resistance Levels: Open interest can also help identify key support and resistance levels. High open interest at specific strike prices may indicate that traders expect the price to gravitate towards those levels, creating potential areas of interest for future trades.
Common Misconceptions
1. Open Interest Indicates Market Direction
One of the most prevalent misconceptions is that open interest alone can indicate the direction of the market. While an increase in open interest may suggest that new money is entering the market, it does not inherently indicate whether the market is bullish or bearish. Traders should consider open interest in conjunction with price movements and volume to gain a clearer picture.
2. High Open Interest Means Strong Market Sentiment
Many believe that high open interest signifies strong market sentiment. However, high open interest can exist in both bullish and bearish markets. It is essential to analyze the context of open interest changes alongside price trends to understand market sentiment accurately.
3. Open Interest is the Same as Volume
Traders often confuse open interest with trading volume. While volume measures the number of contracts traded within a specific period, open interest reflects the total number of outstanding contracts. Both metrics provide valuable insights, but they serve different purposes in market analysis.
How to Interpret Open Interest Correctly
1. Analyze Open Interest with Price Trends
To interpret open interest effectively, it should be analyzed alongside price trends. For instance, if open interest rises while prices increase, it may indicate a strong bullish trend. Conversely, if open interest rises while prices decline, it could suggest a bearish sentiment.
2. Consider Volume in Your Analysis
Incorporating volume into your analysis can provide a more comprehensive understanding of market dynamics. A rising open interest with increasing volume typically suggests that the current trend is likely to continue, while rising open interest with declining volume may indicate a potential reversal.
3. Look for Divergences
Divergences between open interest and price movements can signal potential market reversals. For example, if prices are rising but open interest is falling, it may suggest that the upward trend is losing strength and could reverse soon.
4. Use Open Interest as a Confirmation Tool
Open interest should be used as a confirmation tool rather than a standalone indicator. It can help validate other technical indicators or trading signals, providing a more robust basis for making trading decisions.
How TradingFlow Uses Open Interest
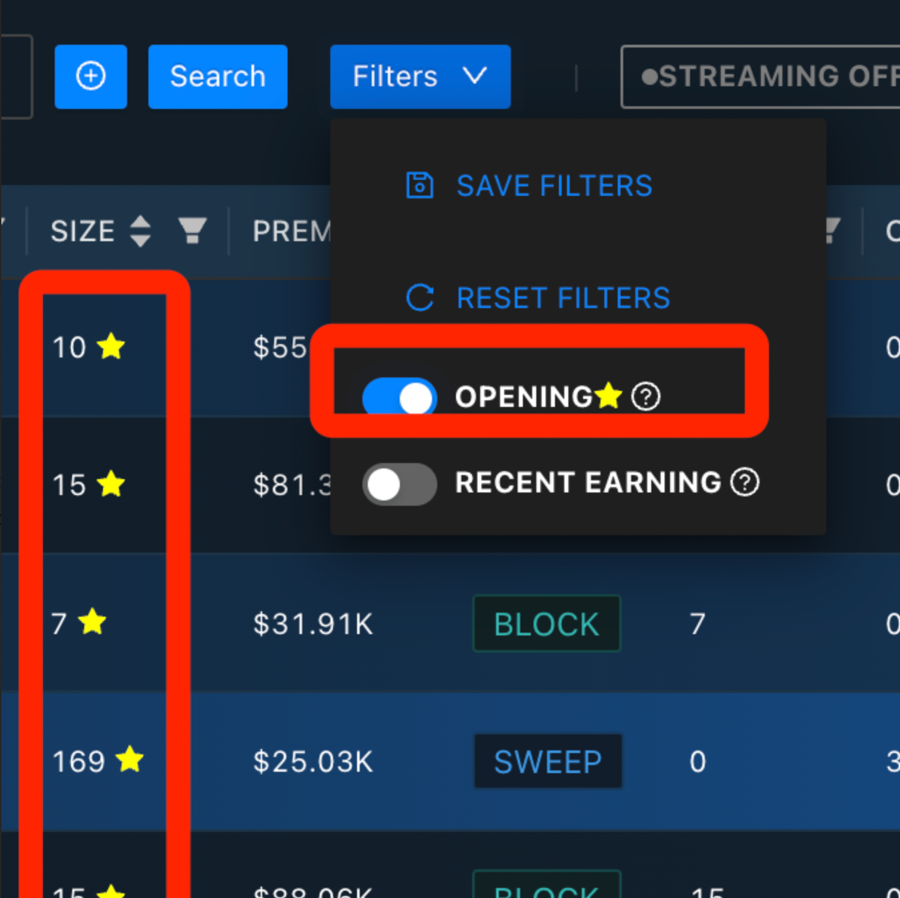
Use the Opening Filter
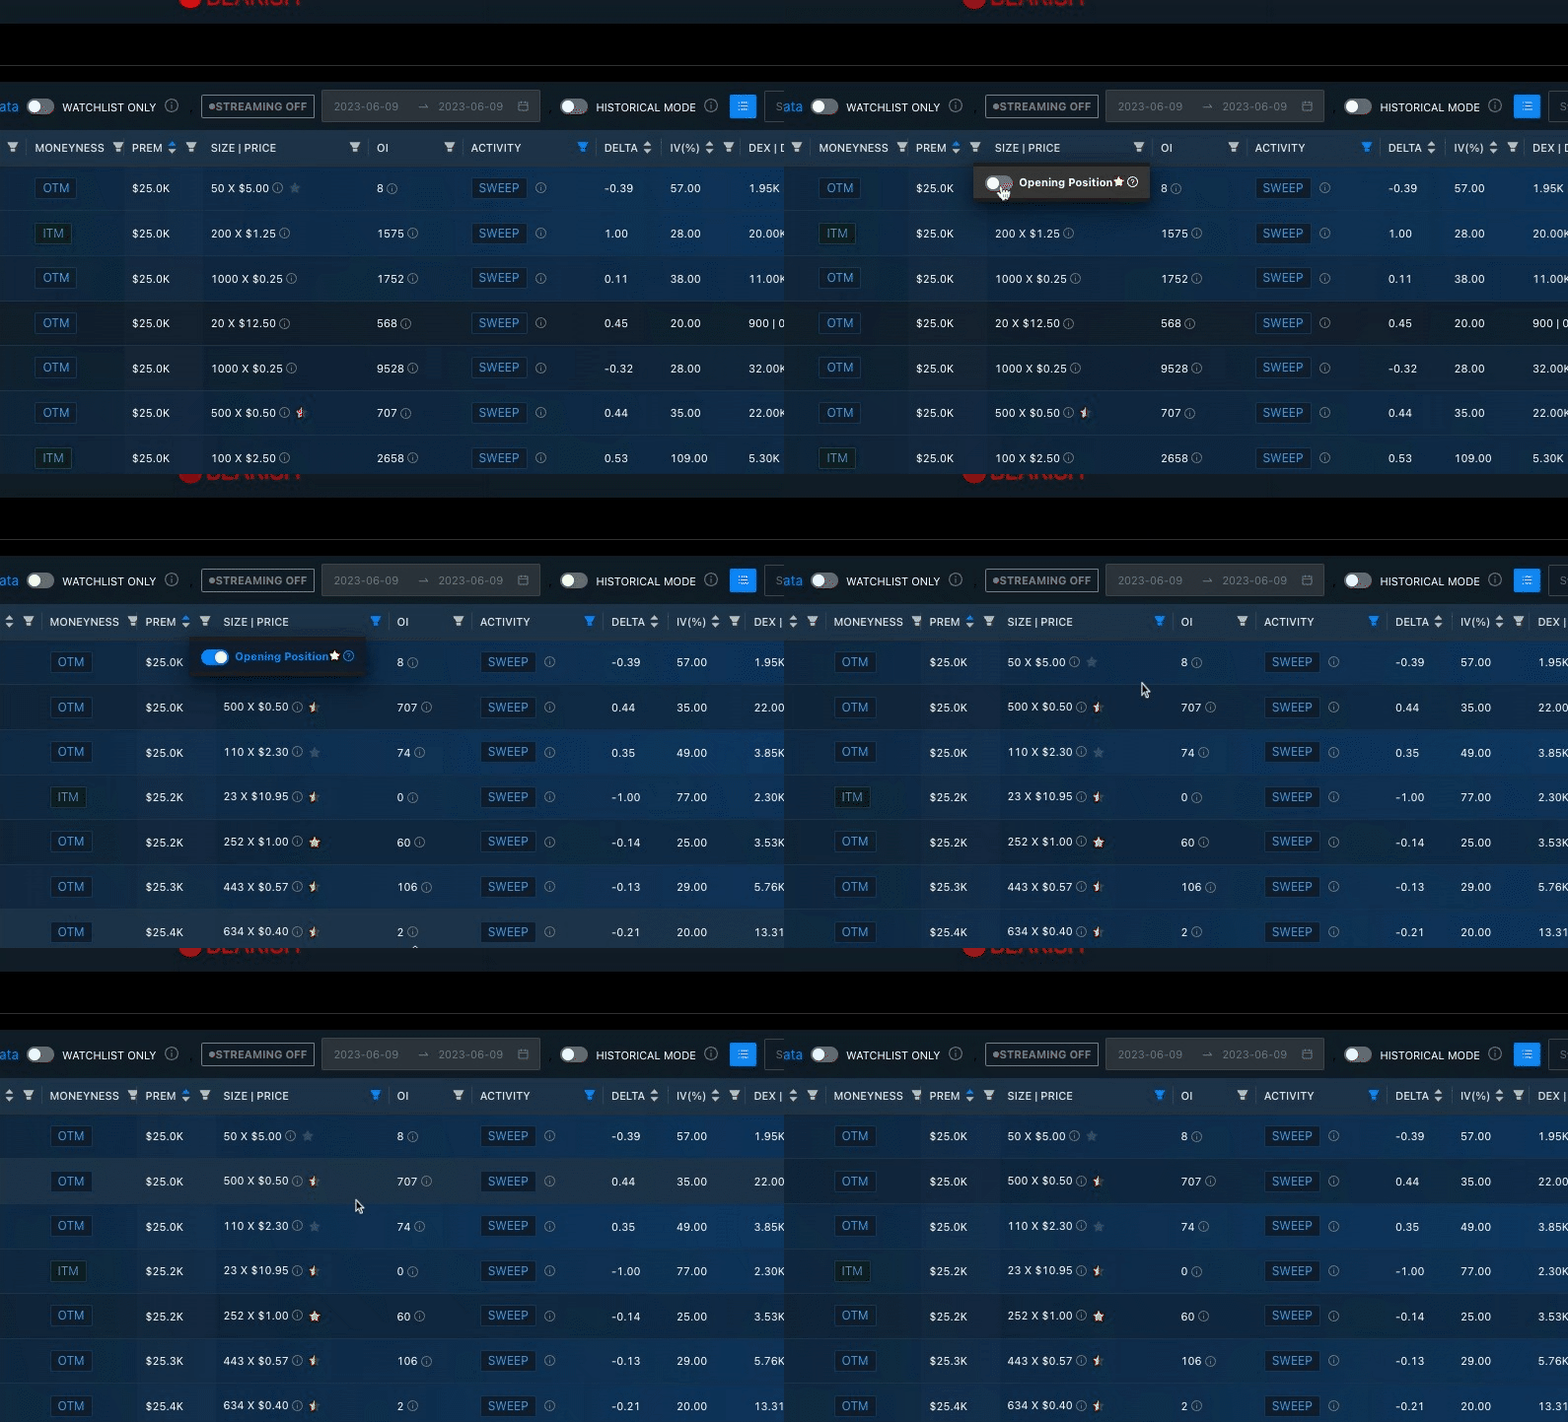
The Opening filter highlights option flow that likely represents newly opened positions—not trades tied to existing contracts. It works by filtering for orders that:
Exceed the current open interest, and
Are larger than 50% of the day’s total volume
For example, if a trader buys 1,000 contracts but the open interest is only 100, it likely reflects a new opening trade. This is because the dealer must initiate new positions to fill the order.
When the Opening filter is enabled, only these high-conviction, opening trades are shown—removing noise from rollover or closing activity. This helps users focus on fresh directional bets in the options market.

How is the opening tag calculated?
The opening position tag appears when the order size exceeds both the cumulative volume from the previous day and the total open interest. This is the only reliable method to determine whether a position is indeed opening. In mathematical terms, it can be expressed as: (Size of Trade) > (Preceding Volume + Open Interest) = New Position.
However, this does not confirm whether the position is long or short. Such a conclusion is speculative and based on contextual information. The only certainty is that the position is new.

Difference between ASK SIDE and BID SIDE

While both orders shown above are opening orders, there is a distinction in their trading dynamics. An opening order executed on the ASK SIDE is more likely to be sold by the Market Maker and bought by the trader. Conversely, an opening order executed on the BID SIDE is more likely to be bought by the trader and sold by the Market Maker.
In short,
"Ask" is the price someone is willing to sell at (the sell side).
"Bid" is the price someone is willing to buy at (the buy side).
The side on which the trade executes gives clues about who is initiating the trade and their market sentiment.
For instance, If a call trade is executed at the ask, it likely means a buyer is aggressively taking the offer → bullish intent.
Call
Ask
Buyer
Buying call
Bullish
Call
Bid
Seller
Selling call
Bearish
Put
Ask
Buyer
Buying put
Bearish
Put
Bid
Seller
Selling put
Bullish / Neutral
How to verify the opening position

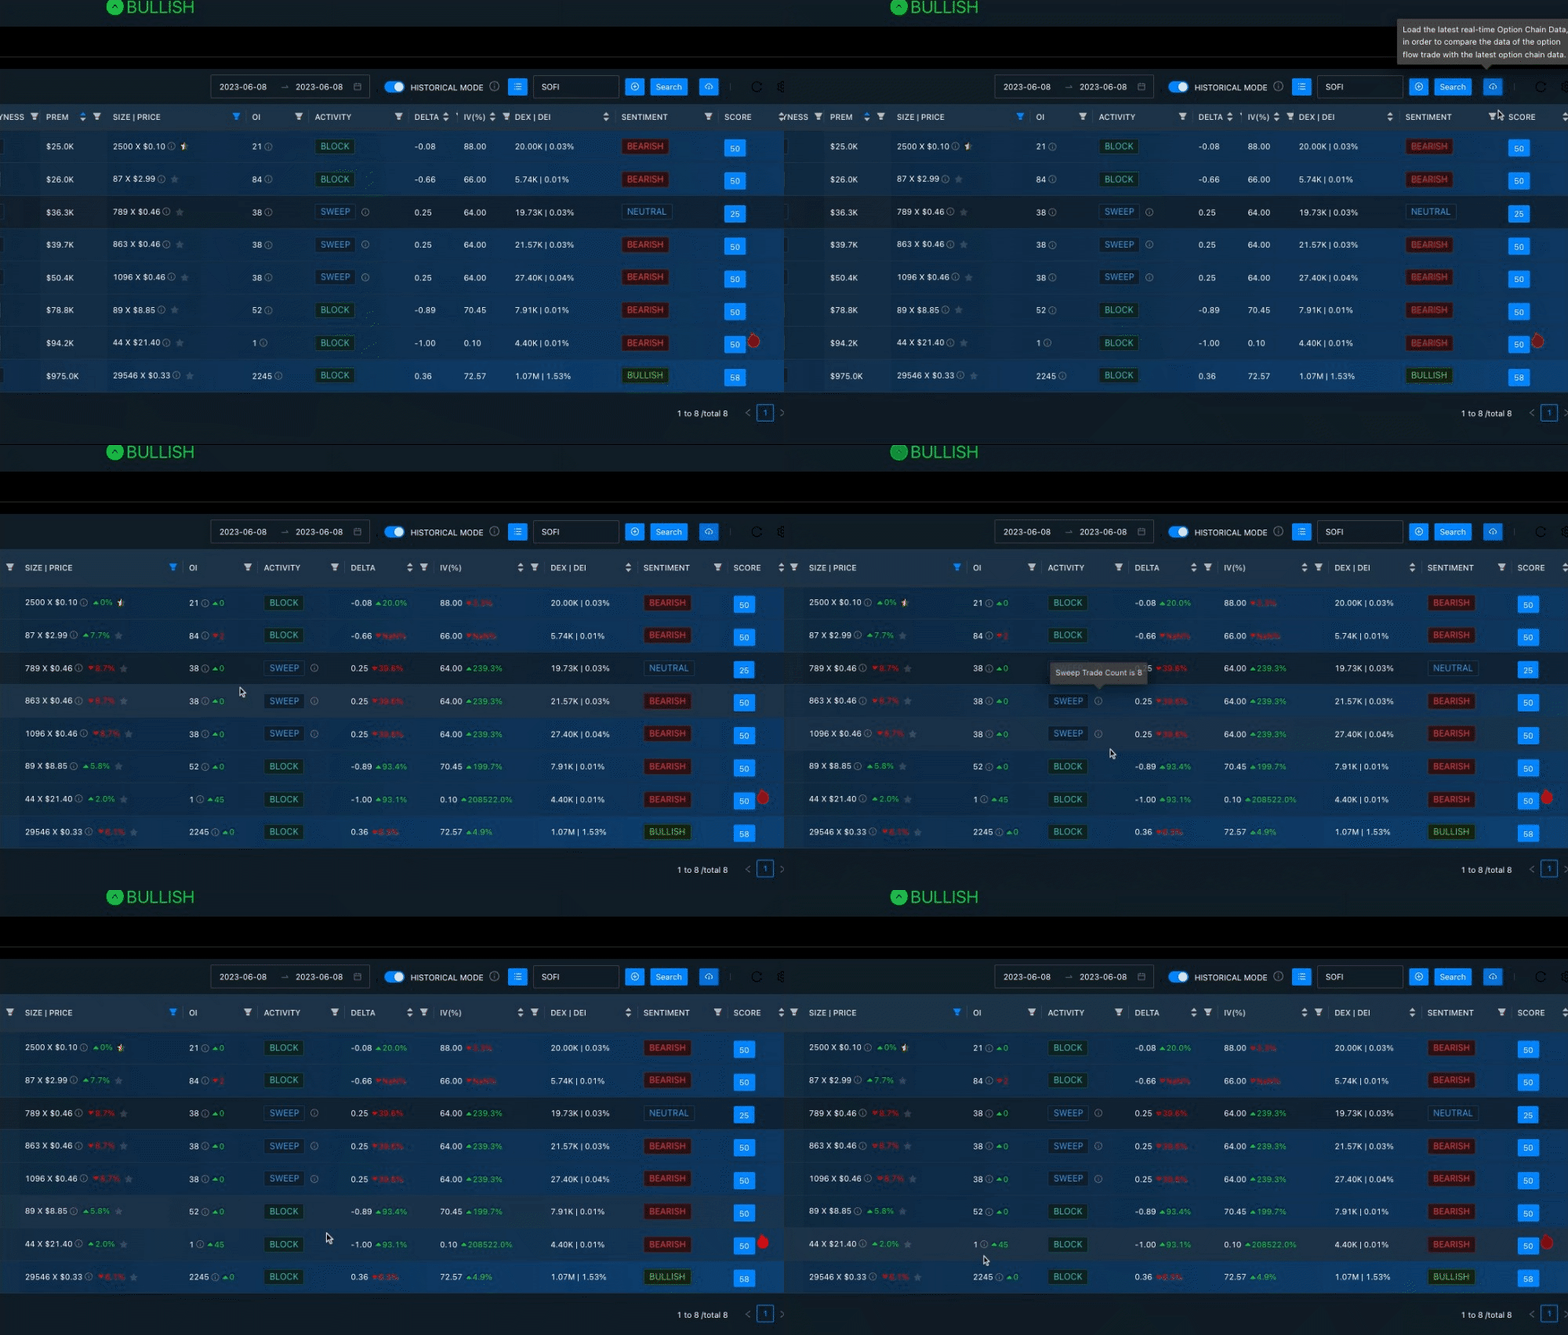
We can confirm whether a trade opened a new position by checking the change in open interest the following day.
In this example from 06/08/2023, there’s a PUT option order for SOFI with a size of 44 contracts and an open interest of only 1—indicating the position is likely opening, since the order size exceeds the existing open interest.
To verify this, we check the option chain data on 06/09/2023. The updated open interest is now 45, which equals:
1 (prior open interest) + 44 (new trade size) This confirms that the order from 06/08 added new open positions and was opening in nature.

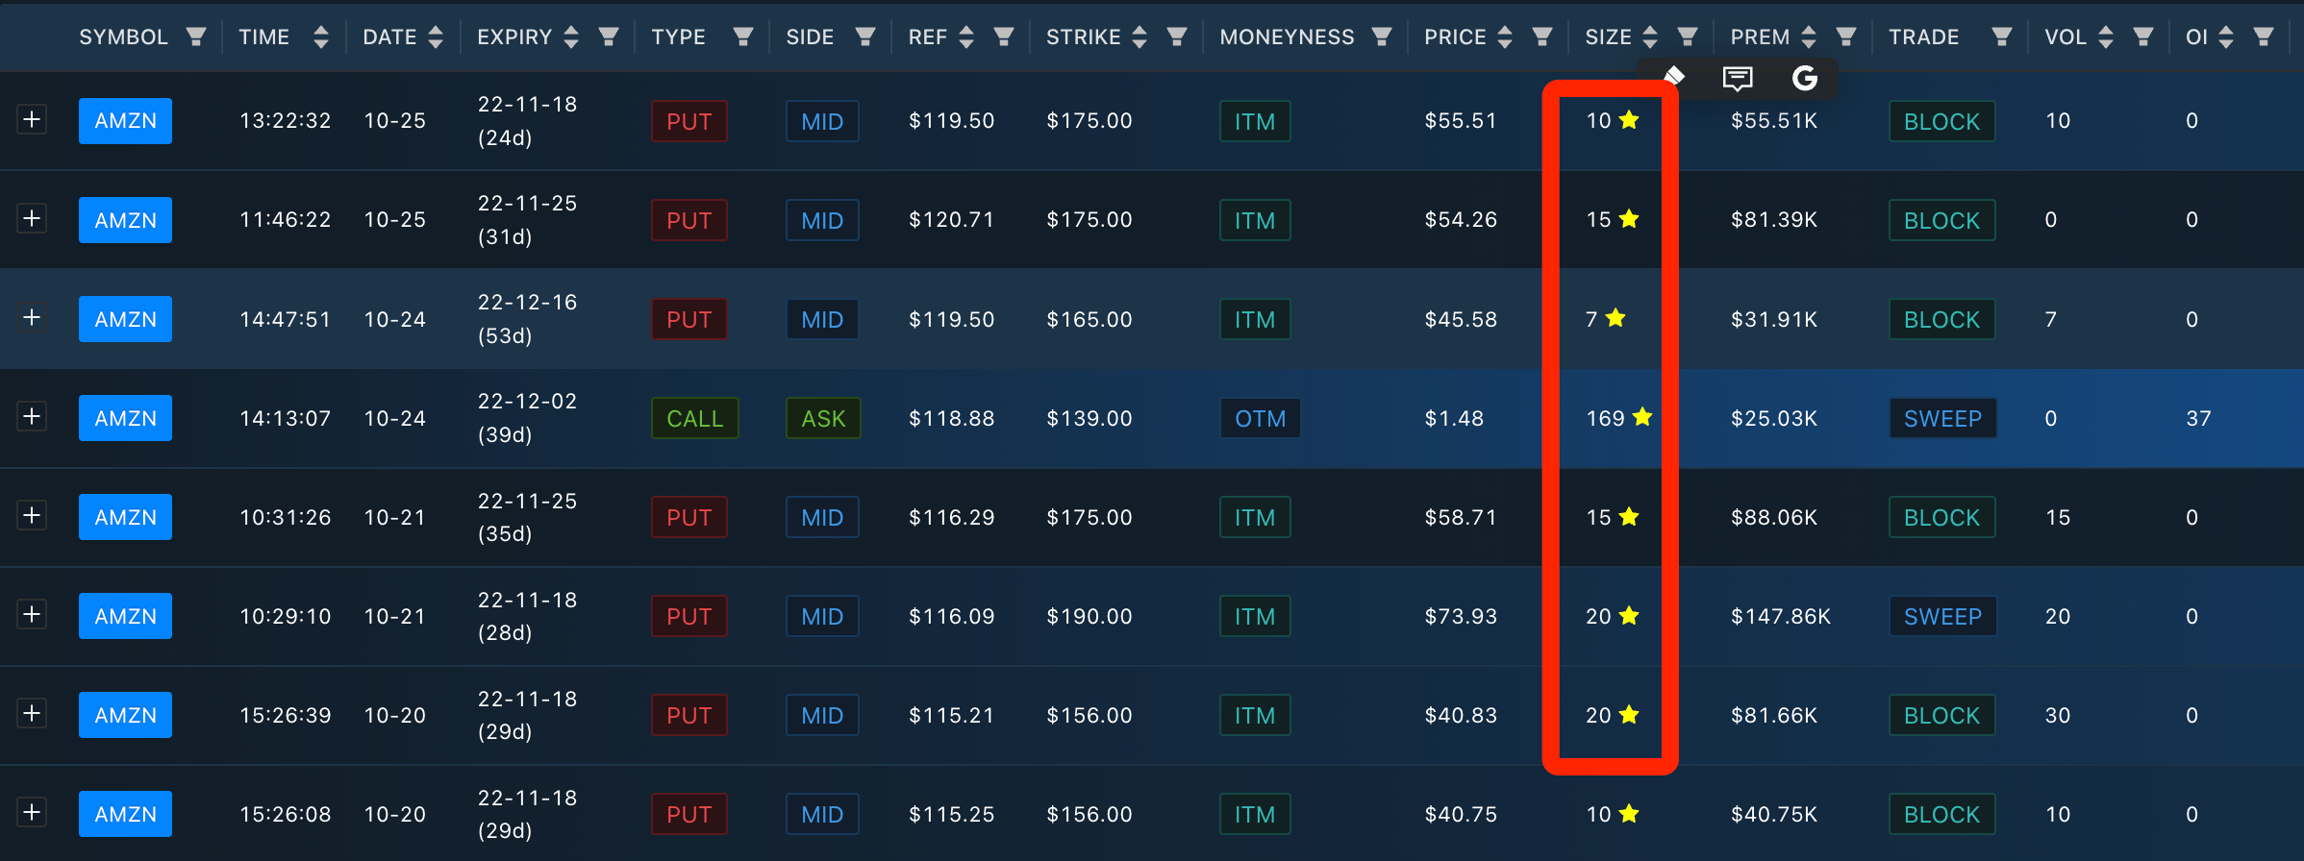
Case Study: Spotting Bearish Bets Before AMZN’s Drop
On Oct 27th,2022, Amazon shares plunged more than 20% after hours. If we search the options flow with the opening filter on, we can identify that traders placed orders on puts from Oct 20th to Oct 25, and these option contracts has 0 open interests, so those orders are all open to buy, which is very aggressive sentiment, so we can tell that this trader had solid confidence and placed a huge bet on that the AMZN will plunge after earning report for Q3.

By surfacing these trades early, TradingFlow helped flag unusual bearish positioning days before the earnings drop—highlighting potential smart money moves before the news broke.
Last updated