Intro to Gamma Exposure
Greetings everyone, we're the TradingFlow Team, and today we're thrilled to offer you a complimentary walkthrough of some key transactions from the week to aid you in your trading endeavors!In this edition, we'll be focusing on the Tradingflow Gamma Exposure (GEX) tool, using a real example directly from our platform. Understanding Greeks can be challenging, but our aim is to simplify the process, and hopefully, our Tradingflow tools will make it clearer for you!
Gamma: What is it?
Gamma represents the instantaneous rate of change of delta. It's worth noting that gamma is the only second-order Greek that directly correlates with the price movement of the underlying asset.Gamma is frequently grouped with the first-order Greeks due to its significance in options trading.Another important point is that gamma remains consistent for both call and put options. Long calls/puts exhibit positive gamma, while short calls/puts display negative gamma.
Gamma Exposure(GEX): What is it?
Spot Gamma Exposure (GEX) is the estimated dollar value of gamma exposure that market makers must hedge for every 1% change in the underlying stock's price movement. A positive GEX indicates a long gamma position, while a negative GEX indicates a short gamma position.Investors and large funds mitigate risk and safeguard their investments by selling calls and purchasing puts. Market makers play a crucial role in providing liquidity to facilitate these trades.The GEX calculation assumes that market makers are involved in every transaction and that the majority of their trades involve buying calls and selling puts to investors seeking to hedge their portfolios.For instance, if a market maker holds one contract with a gamma value of 0.05, then a 1% move in the underlying stock price would expose the market maker to $[0.05 gamma * (100 shares * 0.01) * stock price * underlying parameter of the Greek variable]. The total spot exposure for market makers is determined by aggregating the spot exposure of all open contracts, which is determined either by daily open interest or by volume.
The Gamma View: What Is It?
The Tradingflow Gamma View is a four-way visual representation of gamma, which is determined each morning from open interest using the underlying's spot price at yesterday's closing.
Daily Gamma Exposure (GEX)
Gamma Exposure by Strike
Gamma Exposure by Expiry
Largest GEX by Strike And Expiry
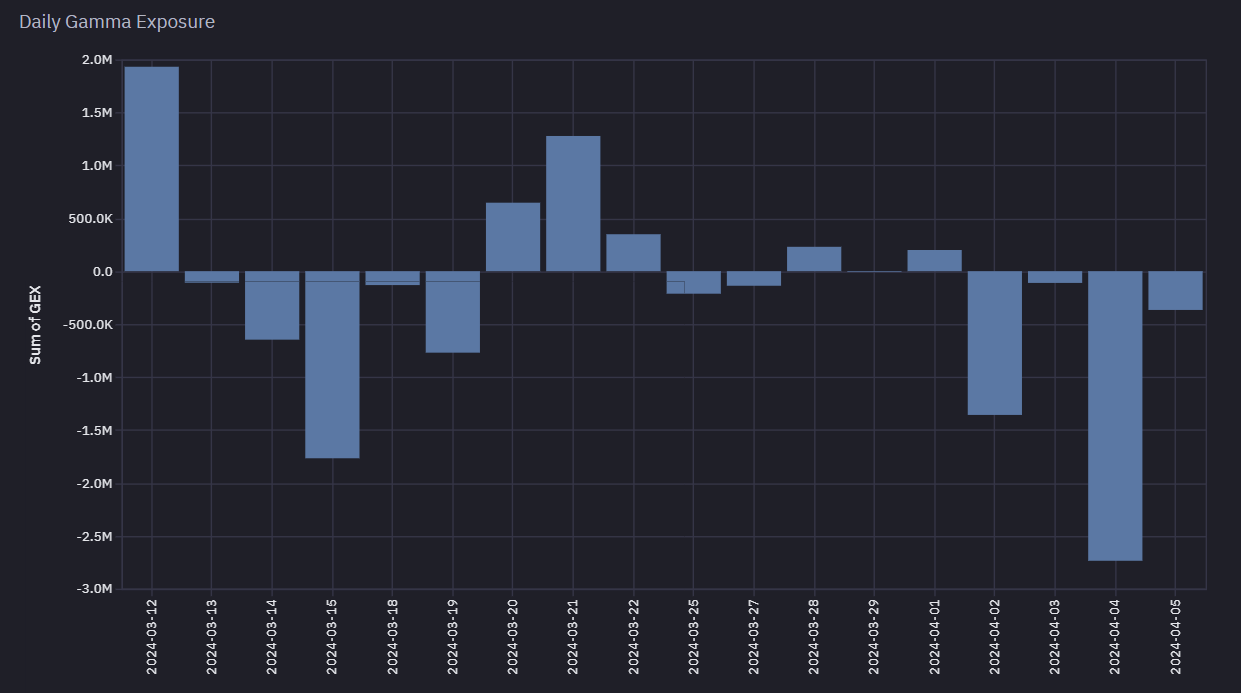
The Daily Gamma Exposure (GEX) shown above represents the total of call gamma and put gamma across all strike prices and expiration dates. Generally, when this sum is positive, indicating more buying pressure from options, realized volatility tends to be lower, resulting in smaller price movements. Conversely, when the sum is negative, suggesting more selling pressure from options, realized volatility tends to be higher, leading to larger price movements.
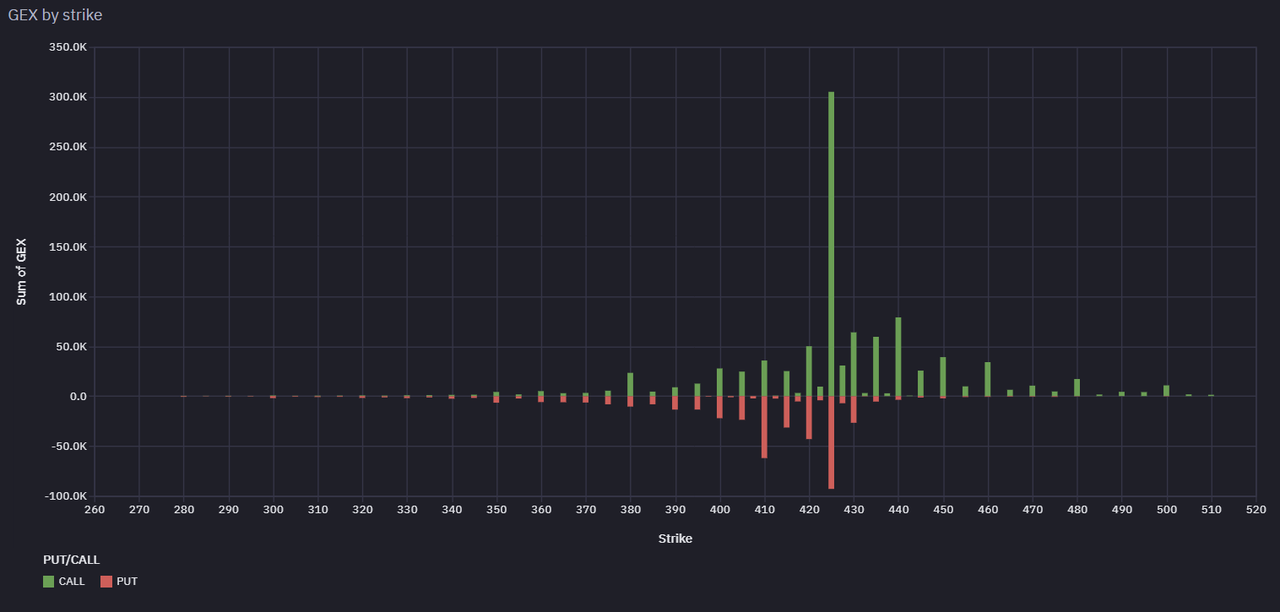
The Gamma Exposure by Strike depicted above illustrates which strike prices across various expiration dates have the highest Gamma Exposure. In the provided image, the $MSFT $425 strike exhibits both the greatest Put Gamma (negative) and the highest Call Gamma (positive). However, it's important to note that the strike with the most Net positive or Net negative Gamma might not always coincide with the strike exhibiting the highest Call or Put gamma; this depends on the cumulative value of Call Gamma (positive gamma) and Put Gamma (negative gamma).
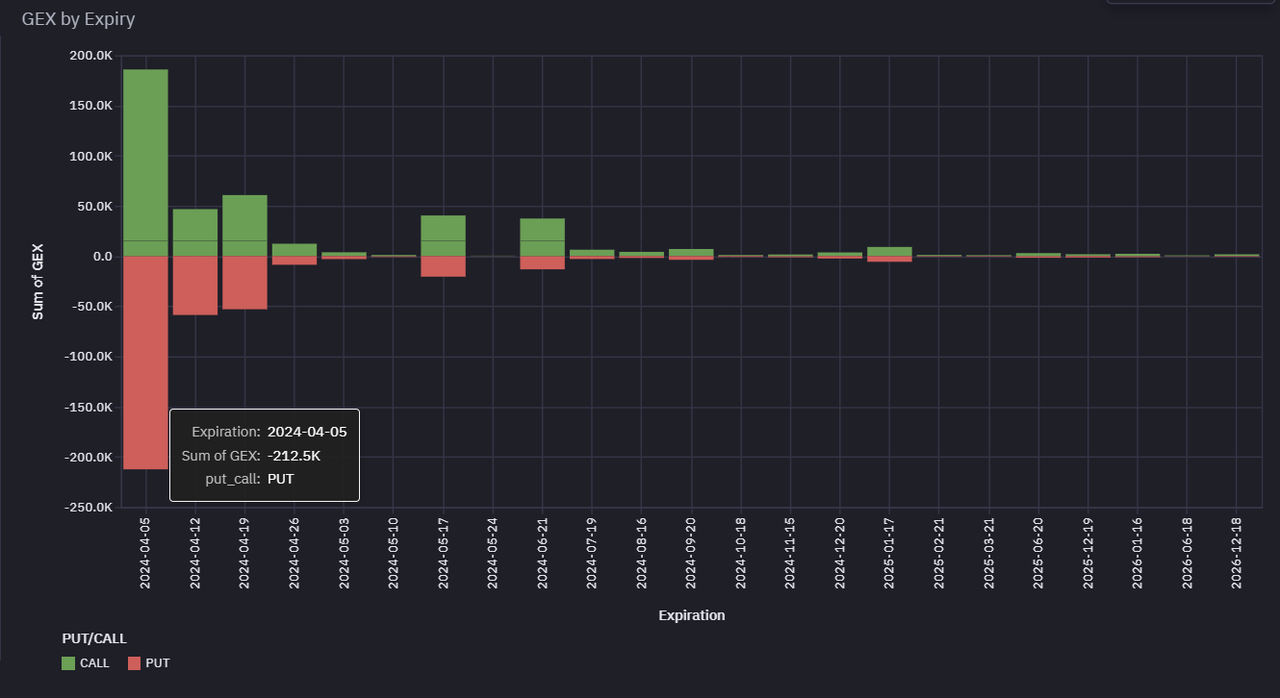
The Gamma Exposure by Expiry depicted above illustrates which expiration date, across all strikes, holds the highest Gamma Exposure. In the provided image, it is evident that the expiration date with the greatest Gamma Exposure for both Puts and Calls across all strikes for $NVDA is the April 5, 2024 expiration.
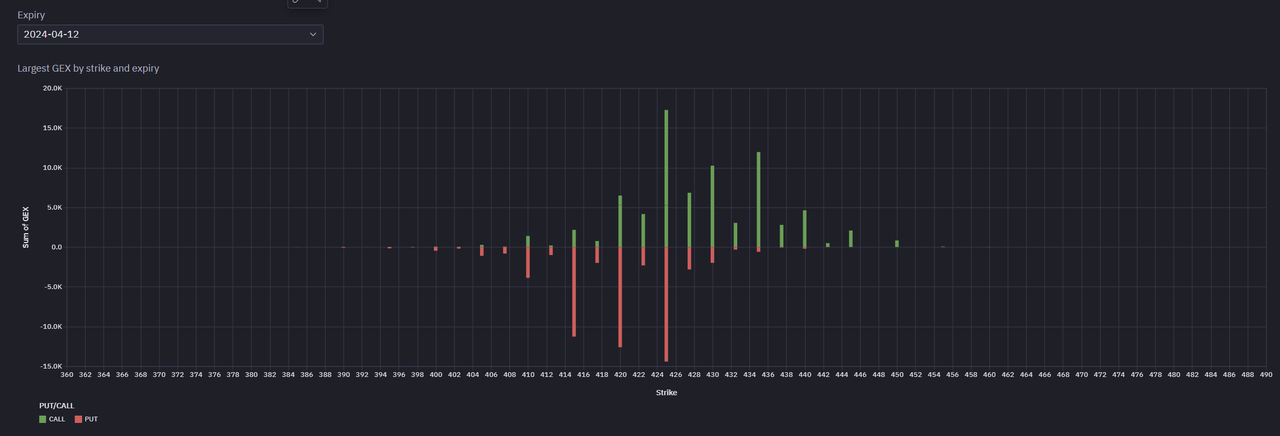
The chart above, titled "Largest GEX By Strike And Expiry," illustrates the Gamma Exposure (GEX) by strike, organized by expiry date (which can be adjusted using the dropdown menu above the chart). It's important to remember that gamma tends to be larger in expiration dates closer to the present compared to those further in the future. Additionally, within the same expiry date, gamma is typically highest at the At-The-Money (ATM) strike and diminishes in both directions as strikes move further away from the ATM. This chart is updated daily, typically in the morning, following updates in Open Interest (OI).
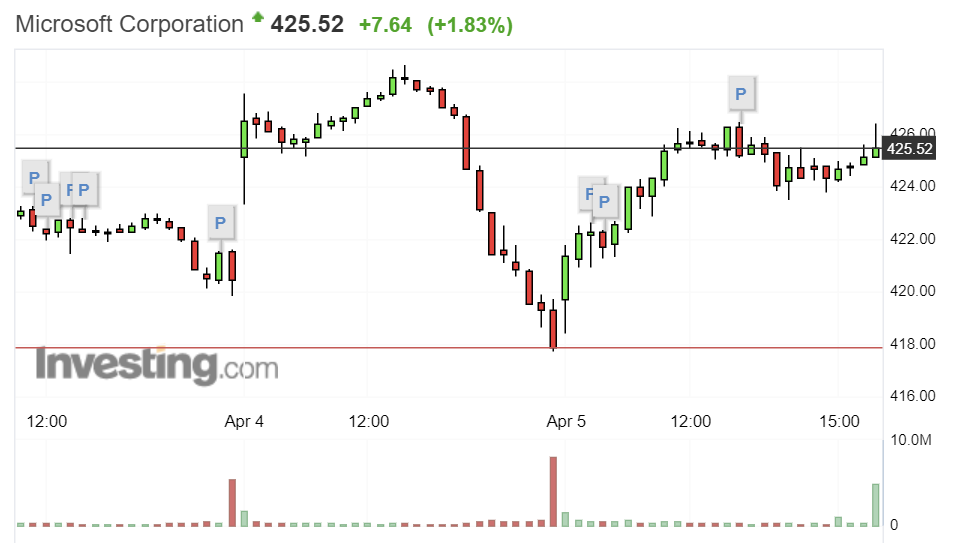
Using the data presented in the Largest GEX By Strike And Expiry chart from pre-market on Tuesday, April 5th, 2024, traders can enhance their decision-making process. By analyzing the chart, one can observe that the largest Put (negative) GEX bar for the current week's expiration is at the $425 strike, which was slightly out of the money (OTM) based on the previous day's closing price of MSFT at $425.49. Similarly, the largest Call (positive) GEX bar for this expiration is at $425.If the price of MSFT were to move towards either the $425 or $420 levels, there might be a potential for a mean reversion-type price reversal. This is because these options are short-dated, expiring in a few days, which implies traders have limited time to act on their positions. For instance, if MSFT were to drop towards $420, those holding $420 puts could see a significant appreciation in their value.Conversely, if the price reverses back up from the $420 level, traders holding $420 puts might be prompted to sell to capture profits, fearing it could be the bottom. The one-minute candlestick chart for MSFT on April 5th, 2024, confirms this scenario, showing a dip into the $420 range before a reversal. Traders may mark such price levels visually on their charts for reference.It's crucial to recognize that even if traders don't monetize their $420 puts, the presence of large negative gamma can lead to increased volatility and significant price swings due to buying on the way up and selling on the way down.Thank you for reading! I hope this article and examples help in understanding how to interpret and utilize the GEX tool.