
🥦Delta Exposure(DEX)
Quick Overview
Delta: Delta measures how much an option’s price moves when the underlying stock moves $1. For example, a delta of 0.5 means the option gains $0.50 if the stock rises $1.
Delta exposure: Delta Exposure translates option positions into the equivalent number of shares they represent. A +500 delta exposure behaves like owning 500 shares; a –500 delta behaves like shorting 500 shares.
Delta in Detail
Delta is one of the "Greeks" in options trading, which are metrics used to assess the risk and potential reward of options positions. Specifically, delta measures the sensitivity of an option's price to changes in the price of the underlying asset. It is expressed as a number between -1 and 0 for puts and 0 and 1 for calls.

Call Options: A call option has a delta ranging from 0 to 1. For example, if a call option has a delta of 0.5, it means that for every $1 increase in the price of the underlying asset, the price of the call option is expected to increase by $0.50.
Put Options: A put option has a delta ranging from -1 to 0. For instance, if a put option has a delta of -0.5, it indicates that for every $1 increase in the price of the underlying asset, the price of the put option is expected to decrease by $0.50.
Significance of Delta
Understanding delta is essential for several reasons:
Risk Management: Delta helps traders assess the risk associated with their options positions. By knowing the delta, traders can gauge how much their option's price will move in relation to the underlying asset, allowing for better risk assessment.
Hedging Strategies: Delta is crucial for creating delta-neutral strategies, where traders aim to offset the delta of their options positions with the underlying asset. This approach helps minimize risk and maintain a balanced portfolio.
Directional Trading: Traders can use delta to determine their market outlook. A high delta for a call option indicates a bullish sentiment, while a high delta for a put option suggests a bearish outlook.
Position Sizing: Delta can assist traders in determining the appropriate size of their options positions. By understanding how much exposure they have to the underlying asset's movements, traders can adjust their position sizes accordingly.
Monitoring Changes: Delta is not static; it changes as the underlying asset's price fluctuates and as time passes. Traders must continuously monitor delta to adjust their strategies and positions effectively.

What is Delta Exposure?
Delta exposure refers to the total delta of a trader's options portfolio. It represents the overall sensitivity of the portfolio's value to changes in the price of the underlying asset.

Delta exposure estimates how much a position behaves like owning shares of the underlying stock. To calculate it:
Suppose a trader buys 10 AAPL call options, each with a delta of 0.60. Since each contract represents 100 shares, this results in a +600 delta exposure (10 × 100 × 0.60), equivalent to holding 600 shares of AAPL.
If the trader also sells 5 AAPL call options with a delta of 0.20, this creates a –100 delta exposure (5 × 100 × –0.20).
The net delta exposure is +500 (600 – 100), which behaves like owning 500 shares of AAPL stock.
This means that if AAPL stock moves by $1, your position’s value will change by about $500 — just like if you owned 500 shares.
Understanding Delta Exposure and Dealer Hedging Behavior
Delta exposure reflects how much a market maker (dealer) needs to hedge in response to a trader’s position. When a trader opens an option trade, the dealer typically takes the opposite side and must hedge the directional risk by buying or selling shares of the underlying stock.
For example, if a trader buys one at-the-money call option with a delta of 0.5, the dealer would sell 50 shares to stay delta-neutral. As the stock price moves, the option’s delta changes, requiring the dealer to adjust their hedge—buying or selling shares accordingly.
By holding the option and dynamically hedging its delta, the dealer reduces directional risk while providing liquidity. If volatility is high, these frequent adjustments can generate trading profits that may exceed the initial cost of the option position.
Case Example: Consider IBM 160 strike calls expiring Nov 18, 2016. At trade time, the call was at-the-money with a 0.5 delta. Although the option value declined afterward, the dealer profited by actively hedging as the underlying stock fluctuated.
Date
Call Option Price
Call Option Delta
Net Delta
Stock Price
Shares Bought to Hedge Delta
Shares Sold to Hedge Delta
Call Option PNL
Stock PNL
Combined PNL
2-Sep-2016
4.92
0.500
50
159.57
50
6-Sep-2016
5.15
0.522
2
160.27
2
+23.00
-35.00
-12.00
7-Sep-2016
5.90
0.562
4
161.51
4
+98.00
-99.48
-1.48
8-Sep-2016
4.55
0.482
-8
159.01
8
-37.00
+40.52
+3.52
9-Sep-2016
3.45
0.386
-9
155.70
9
-147.00
+199.40
+52.40
12-Sep-2016
4.23
0.458
7
158.31
7
-69.00
+97.61
+28.61
13-Sep-2016
3.45
0.390
-7
155.94
7
-147.00
+206.93
+59.63
Q & A
How TradingFlow Uses Delta Exposure
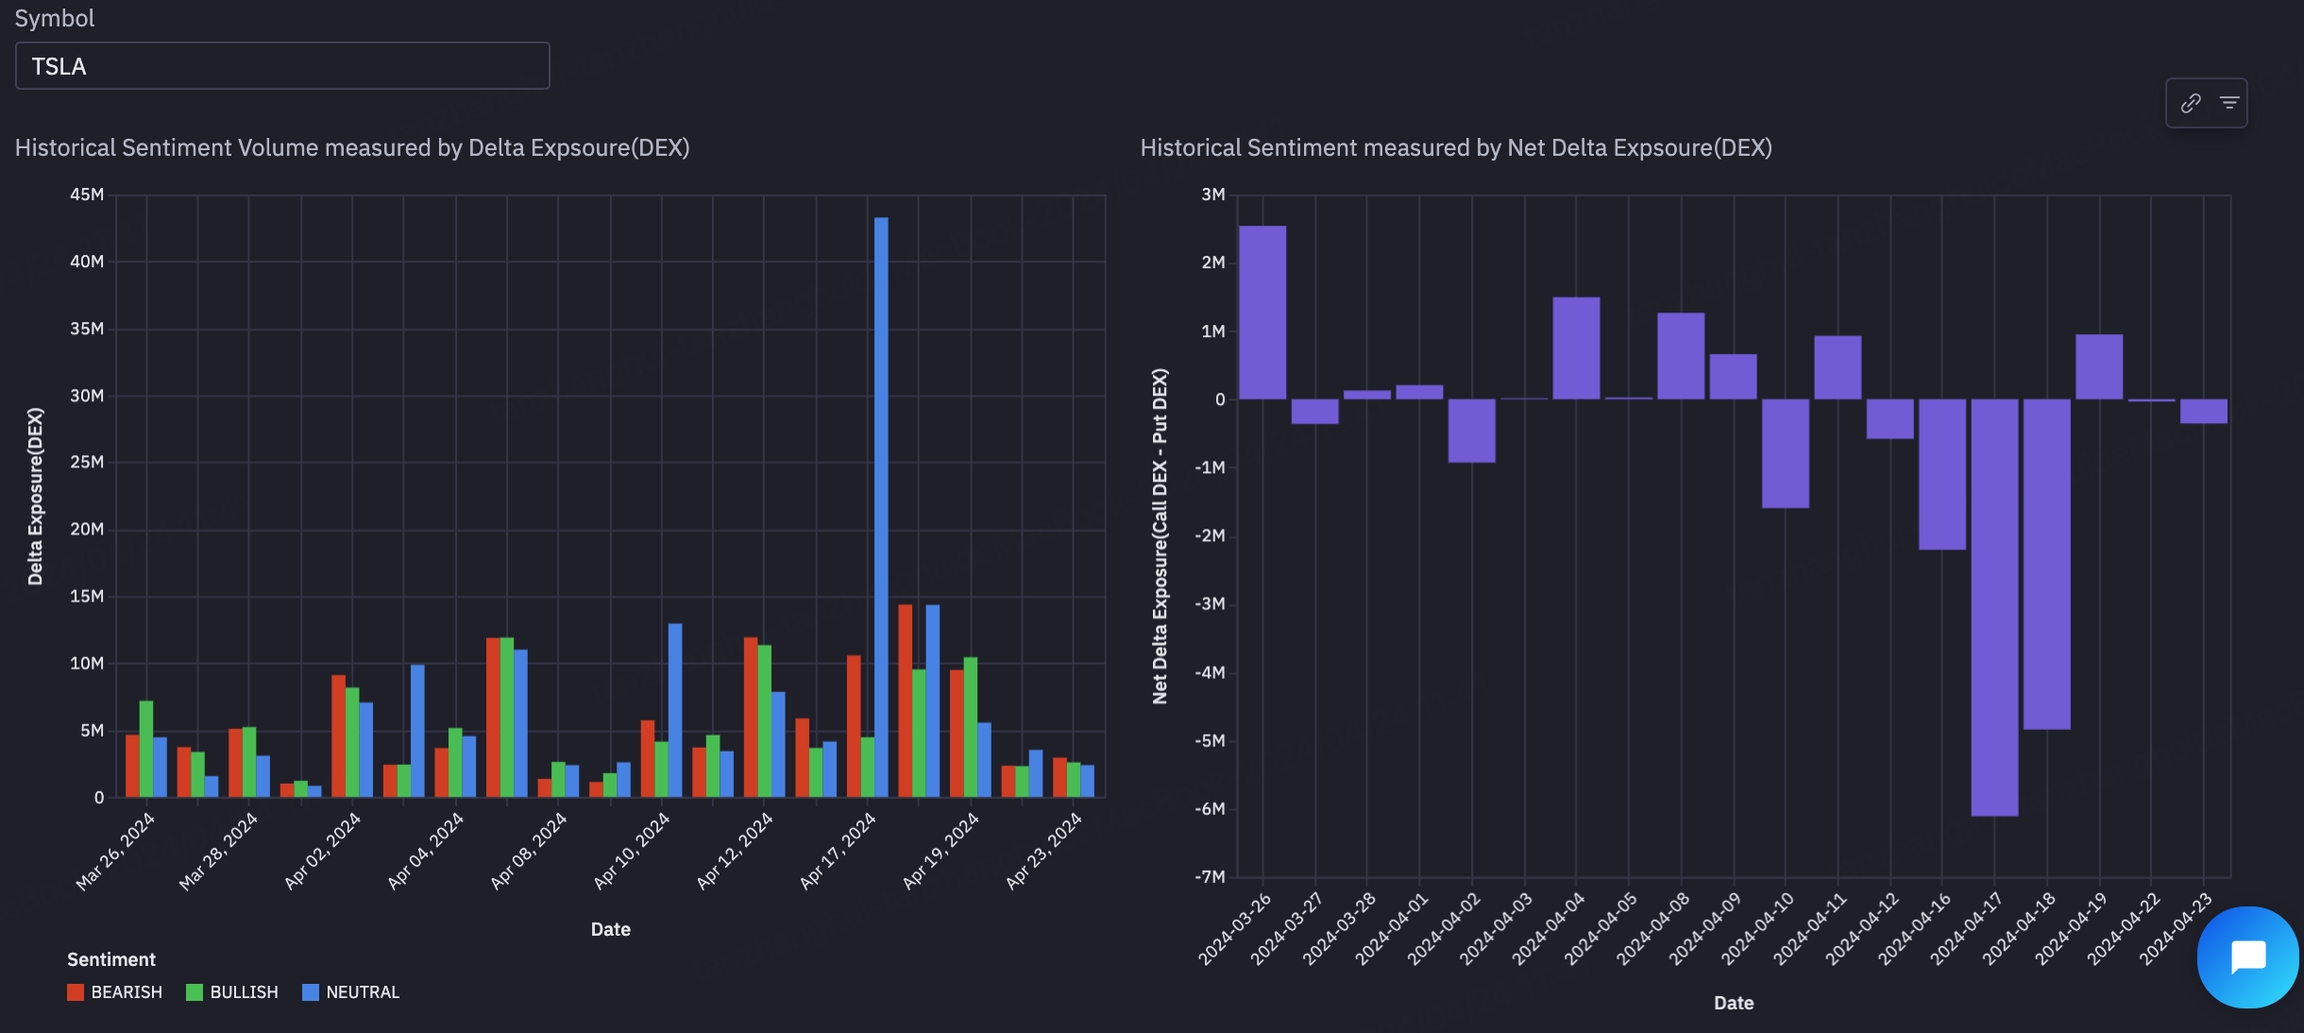
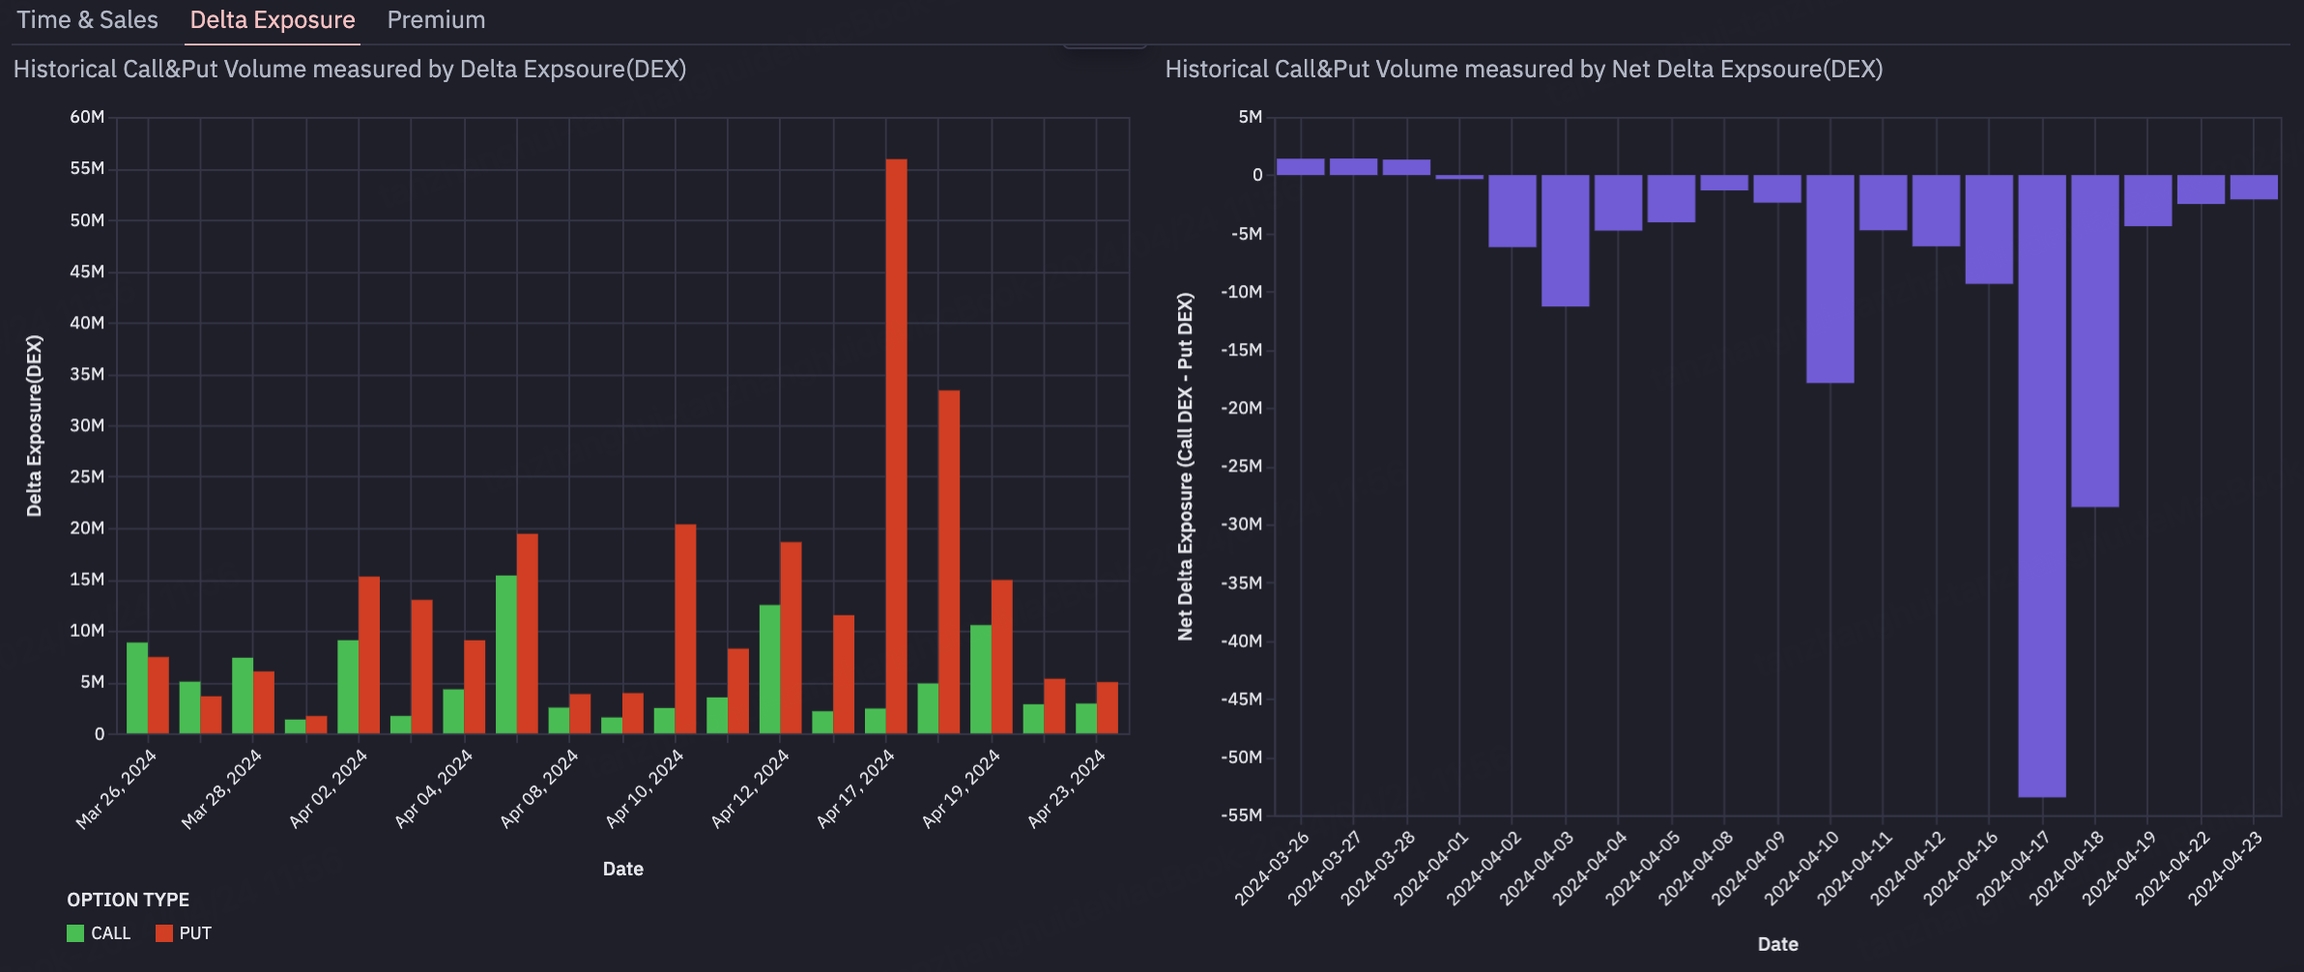
DEX (Delta Exposure)
On TradingFlow Full Option Flow page, you can view DEX data based on stock codes to obtain sentiment, call, and put data quantified by DEX.
You can also use the Contract Explorer to view DEX dimension data for specific option contracts.
What is Delta Exposure Imbalance?
Delta exposure on-balance (or imbalance) shows whether the overall option flow is more bullish or bearish.
It’s calculated as: Net Delta Exposure = Total Positive Delta – Total Negative Delta
A positive value suggests bullish pressure.
A negative value indicates bearish pressure.
This helps traders quickly assess market sentiment based on actual positioning, not just price.
Why Delta Exposure Is More Reliable than Premium?
Delta exposure is a direct measure of directional risk. It shows how much an option’s price changes when the stock moves.
High delta = strong sensitivity to stock movement = clearer sentiment signal.
Premium, on the other hand, is affected by:
Time decay
Implied volatility
Interest rates
Intrinsic value
Unlike premium, delta exposure cuts through external noise and reveals the true directional intent behind an options trade—making it a more reliable indicator of market sentiment.
Why Delta Exposure Is More Reliable than Notional Value?
Notional value refers to the total dollar amount spent on an option trade (e.g., price per contract × number of contracts × 100 shares). It tells you how much money was involved, but not how much directional exposure the trade carries.
Why it's unreliable:
Options vary in strike price and expiration, which can distort the meaning of dollar value.
Spending more doesn’t always mean greater directional risk.
Example:
Buying 10 deep in-the-money contracts at $100 = $100,000 notional, but delta exposure = 1,000
Buying 100 at-the-money contracts at $1 = also $100,000 notional, but delta exposure could be much higher depending on delta
Notional value shows cost, not impact. Delta exposure, by contrast, shows how much a trade actually moves with the stock, making it a far better indicator of true market influence.

Last updated