
🥑Implied Volatility (IV)
Quick Overview
Implied volatility reflects the market's expectations of future volatility in the price of the underlying asset. It is derived from the option's market price and indicates how much the market believes the asset's price will fluctuate over a specific period.
Implied Volatility in Simple Terms
Implied volatility is not a direct measure of actual future volatility; rather, it is an estimate based on the supply and demand for options. When traders expect significant price movement in the underlying asset, the demand for options increases, leading to higher premiums and, consequently, higher implied volatility. Conversely, when the market anticipates little movement, implied volatility decreases.
Key Factors Influencing Implied Volatility
Market Sentiment: Positive or negative news can lead to changes in implied volatility. For example, earnings reports, economic data releases, or geopolitical events can cause traders to adjust their expectations of future volatility.
Time to Expiration: Generally, options with longer expiration periods have higher implied volatility because there is more time for the underlying asset to experience price fluctuations.
Underlying Asset Characteristics: Assets that are more volatile by nature, such as tech stocks or commodities, tend to have higher implied volatility compared to more stable assets like blue-chip stocks.
Significance of Implied Volatility
Implied volatility plays a significant role in determining the price of options. Higher implied volatility results in higher option premiums, as it indicates a greater likelihood of the option finishing in-the-money. Conversely, lower implied volatility leads to lower premiums. Traders often use implied volatility to gauge whether options are overpriced or underpriced relative to historical volatility.

Implied volatility plays a crucial role in option pricing and can signal the perceived level of risk in the market. Understanding whether implied volatility is low or high can help investors choose strategies that align with the market environment. The table below compares key characteristics and strategic implications of low versus high IV conditions, helping traders identify opportunities and manage risk more effectively.
Category
Low Implied Volatility (IV)
High Implied Volatility (IV)
Market Outlook
Expectation of relatively stable prices
Anticipation of larger price swings
Investor Sentiment
Generally optimistic or neutral
Often cautious, uncertain, or event-driven
Risk Environment
Seen as lower risk, calmer market
Viewed as higher risk, prone to sudden changes
Option Pricing
Premiums are typically more affordable
Options are priced at a premium due to uncertainty
Strategic Approaches
Prefer income-based or range-bound trades (e.g., covered calls, vertical spreads); may also look to buy undervalued option
Favor volatility-based trades (e.g., straddles, strangles); opportunity to sell rich premiums
Volatility Smile
The volatility smile is a pattern observed when plotting the implied volatility (IV) of options against their strike prices for a given expiration date. Instead of forming a flat line — as assumed by the Black-Scholes model — the plot often curves upward at both ends, creating a shape resembling a smile.
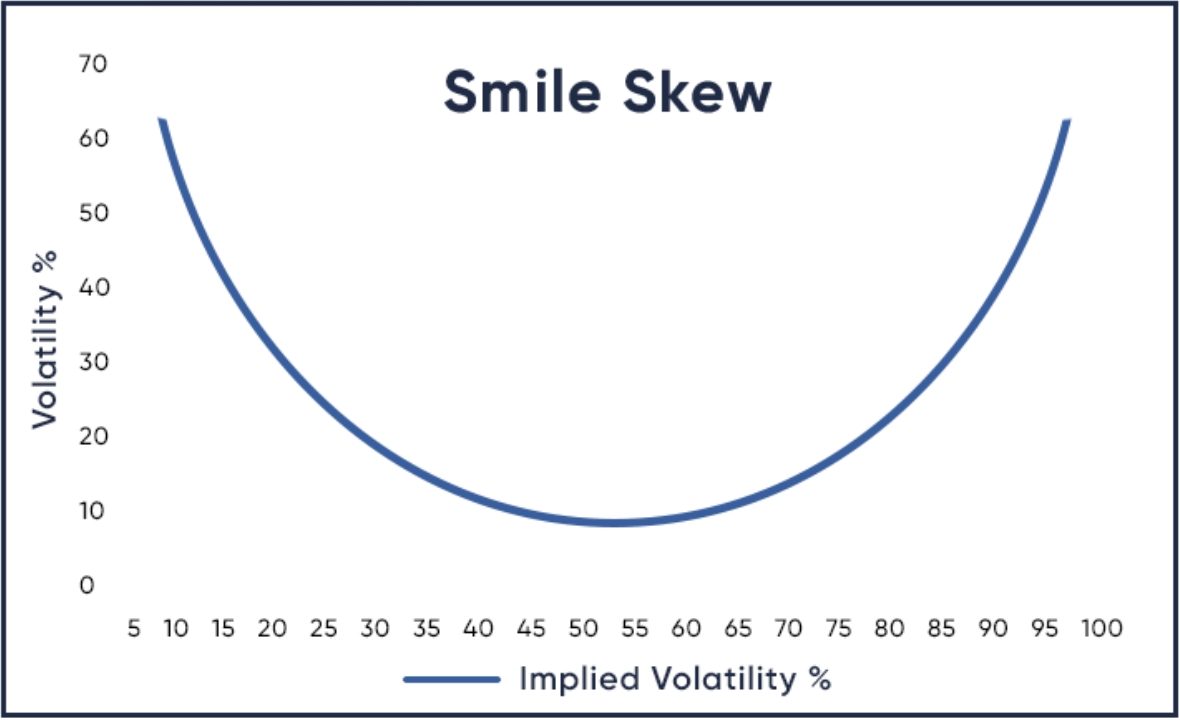
Why It Happens
Several market-driven factors contribute to this pattern:
Crash Risk: Investors often buy OTM puts as protection against large downward moves, increasing demand and implied volatility for those strikes.
Speculation: OTM calls may also carry higher IV if traders anticipate sharp upward price moves.
Market Realities vs. Models: The smile reflects that real-world asset returns tend to have fat tails — extreme moves are more common than the normal distribution assumed by standard pricing models.
Supply and Demand Dynamics: Heavy trading interest in certain strikes — for hedging or directional views — can elevate implied volatilities.
Key Takeaway
The volatility smile illustrates that implied volatility is not uniform across strikes. Instead, it tends to be higher for strikes further away from the current market price, indicating that market participants assign a higher probability to large price swings than traditional models might suggest.
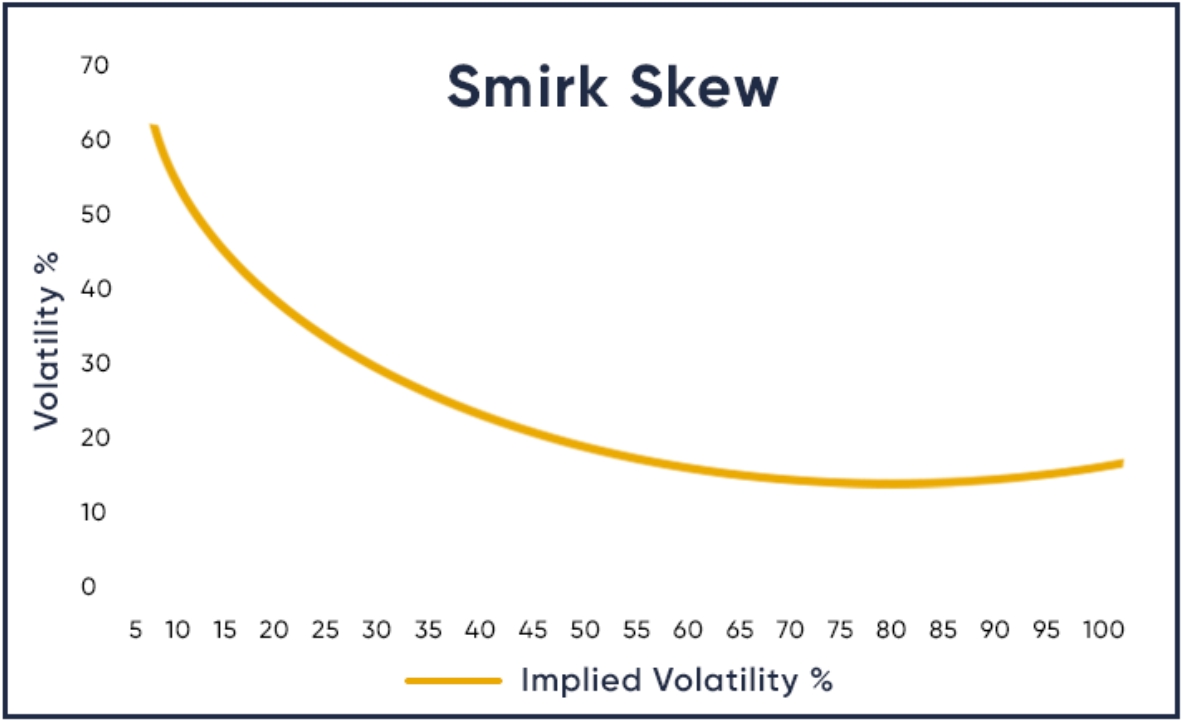
Votalitility Skew
In real markets, implied volatility is often asymmetric, forming a skew rather than a smile. This is particularly common in equity markets, where put options tend to have higher implied volatility than call options. When plotting IV against strike prices, the curve typically slopes downward: lower strike prices (puts) show higher IV, while higher strike prices (calls) show lower IV. This reflects investors' greater concern about sharp declines in stock prices (crashes) compared to sharp rises. As a result, puts are in higher demand for hedging against downside risk, while calls often see less demand relative to supply. Implied volatility captures market fear, with puts reflecting this fear more strongly due to their protective nature.
IV Crush
Implied Volatility Crush is a helpful indicator in the options field. Implied volatility of a contract represents the anticipated level of volatility in the underlying stock during the contract's active lifespan, up until its expiration date. During events such as earnings announcements or significant company developments, implied volatility tends to be inflated due to the expected stock movement associated with these events.
Implied volatility can be thought of as a measure of future volatility. However, once the earnings report is released, the implied volatility decreases as the market no longer anticipates a scenario where the stock will experience a significant and unpredictable price swing.
How to analyze option interest liquidation by IV
Changes in open interest (OI) and implied volatility (IV) can help determine the type of position being established or exited:
Long Buildup
Increase
Increase
Traders are adding bullish positions
Long Liquidation
Decrease
Decrease
Traders are closing bullish positions
Short Buildup
Increase
Decrease
Traders are adding bearish positions
Short Covering
Decrease
Increase
Traders are buying back to exit short positions
By combining OI and IV trends, traders gain insight into whether market participants are entering, exiting, or adjusting positions, enhancing the interpretation of option sentiment.
Last updated